Everything
- Details
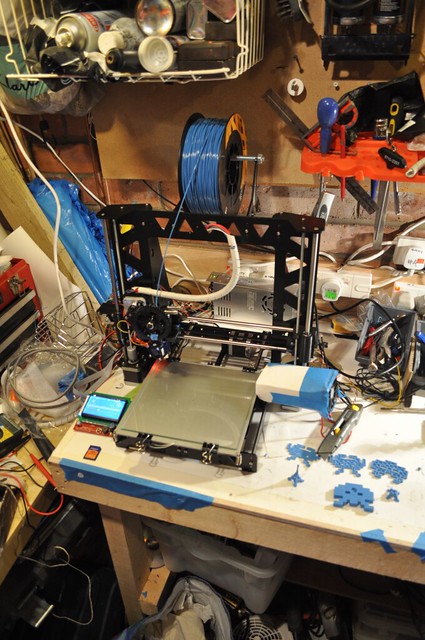
Latest update from me, I got my printer all setup, and calibrated the axis, I ended up with 160 steps/mm for the X and Y axis, 8000 steps/mm for the Z axis and 1942.2716 steps/mm for the extruder. I pushed both my marlin configuration and the Slic3r configuration to github (https://github.com/paulhurleyuk/Marlin and https://github.com/paulhurleyuk/Slic3r).
I then tried a few test prints and got a succession of filament jams, I think for the following reasons (roughly in order);
-
I left the little plastic tube out of the extruder and the filament kinked and jammed
After reassembling the hotend I screwed the heatbreak into the hotend first instead of the heatsink leaving a gap
I had the retraction setting way to high in slicer (10mm) and it was pulling hot filament up into the heatbreak
The wire to the hotend fan broke and the heatbreak got too high
So, I've learned a lot about disassembling my hotend and clearing it out, which generally involves removing the whole hotend, unclipping the fan, unscrewing the nozzle, heatbreak and heatsink, then screwing the heatbreak back into the heater block, heating it and poking the melty filament out, cleaning the hobbed bold and then putting it all back together.
I also tried rubbing a little rapseed oil in a sponge over the filament which seems to have helped as well. I also loosened the filament slightly as the filament holder is a M8 bolt and the reel doesn't spin particularly well on it, at some point I'll add some skate bearings.
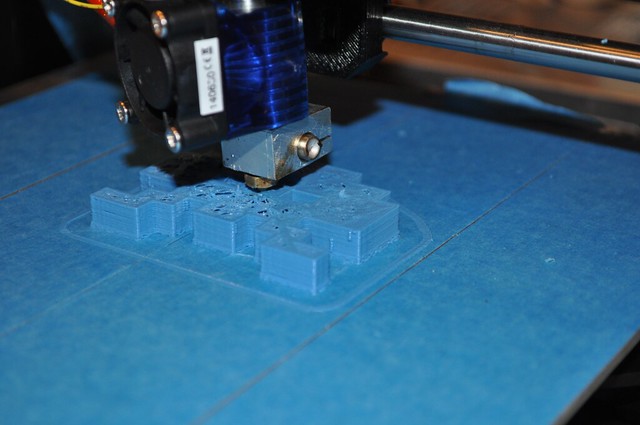
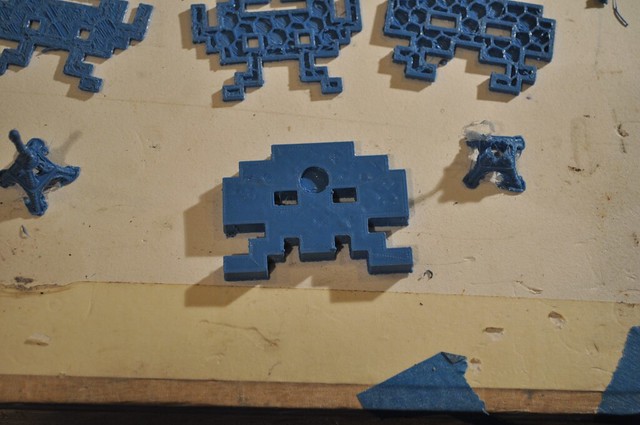
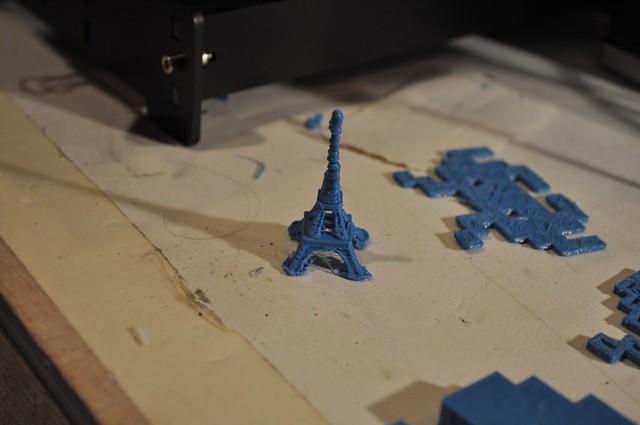
I've now got some successful prints, although they're a little rough;
- Details
I use Git to track changes to my Marlin firmware and Slic3r configs. Here's some notes for myself on how that works.
Setting Up Marlin
I created my original Marlin directory by forking the Marlin repo RC branch in Github, then pulling that repo to my machine
git clone https://github.com/paulhurleyuk/Marlin.git
I can then edit the config, and push the results back to github
git add .

git commit -m "Initial setup"

git push
Setting up Slic3r
Slic3r gets installed and creates its initial configs, so instead of pulling down from github, I want to create a git repo in the existing directory and pushing to github. Creating the empty repo in Github can technically be done from the command line, but its easier in the web. once created do the following
git init

git add .

git commit -m 'message'

git remote add origin https://github.com/paulhurleyuk/Slic3r

git push -u origin master
Pulling changes from the Marlin repo to my fork
git remote add upstream https://github.com/MarlinFirmware/Marlin

git fetch origin

git fetch upstream

git merge upstream/RC
Then resolve and conflicts (usually with configuration.h, edit the file and look for the <<< and >>> markers
git add .

git commit -m "Merge upstream changes"

git push origin
- Details
So, I got a reply both on the RepRap forum and direct from Orballo, Yes, the plastic tube goes inside the extruder body above and flush with the hot end. The hot end is then secured in place being pinched by two M3 bolts. This tube then guides the 1.75mm filament from the hobbed bolt down to the hotend.
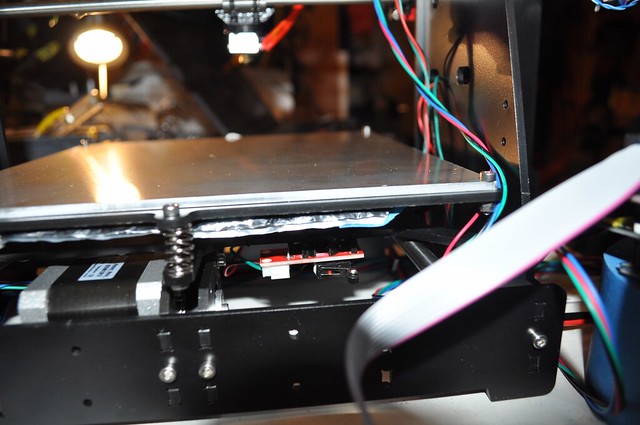
I installed the end stops. the clips provided aren't great, for the X and Z axis they work, but not great
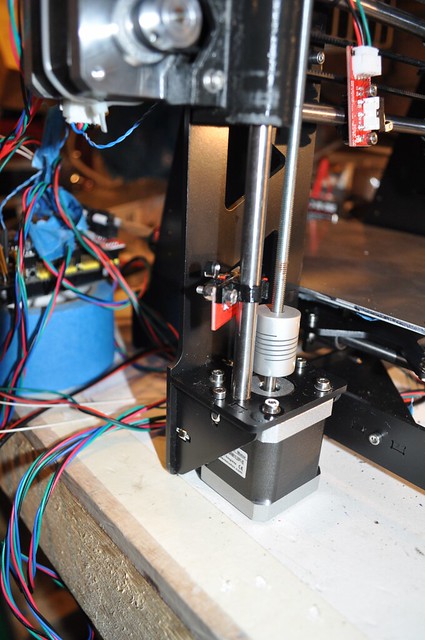
For the Y axis they just didn't work so I ended up supergluing the endstop to the side of the clip, then supergluing that clip to the bottom of the Y carriage where it would strike the rear frame.
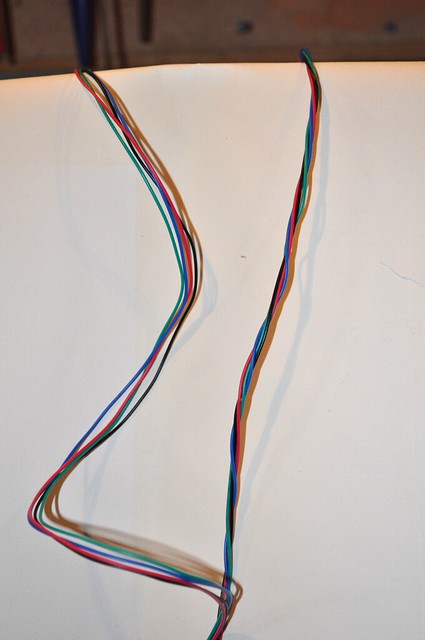
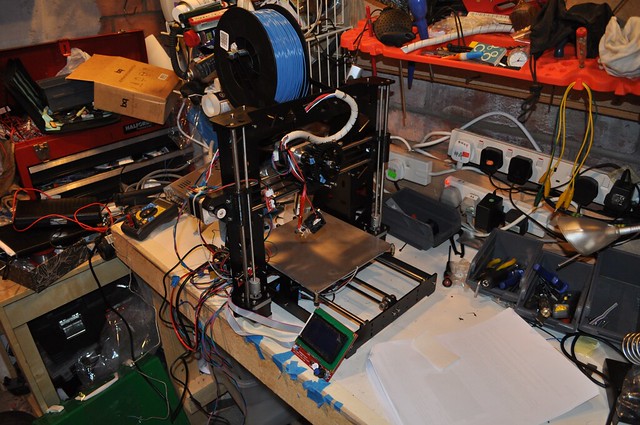
I wired up the frame. The initial wiring was really messy, until I saw this video (https://youtu.be/7l1rb2gWsZM) that totally worked for all of my cable bundles to keep them together. I also added a little spiral wrap. I tried to route the wires as neat as possible, with cable ties where needed, but sadly it looks messier than it should...
I initially wired up the arduino on the bench to check everything worked, which it did. But I think the combination of being there, the tangle of wires and my massive labels on cables stopped any airflow, and the drivers got very hot. I moved the arduino and mounted it to the frame, filing a bolt on two edges for the top left hole and re-wired. much neater
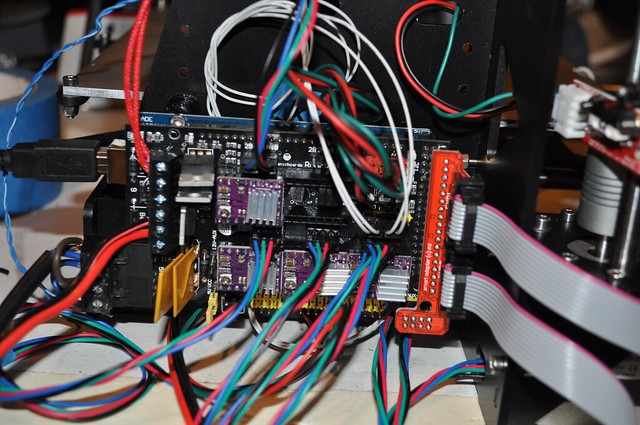
I extended the cable for the fan, and following lots of advice on the net, connected it to the connector just behind the power connector. This worked and the fan was nice and loud, for maybe thirty minutes, until it was very quiet, and smelt of burnt. !
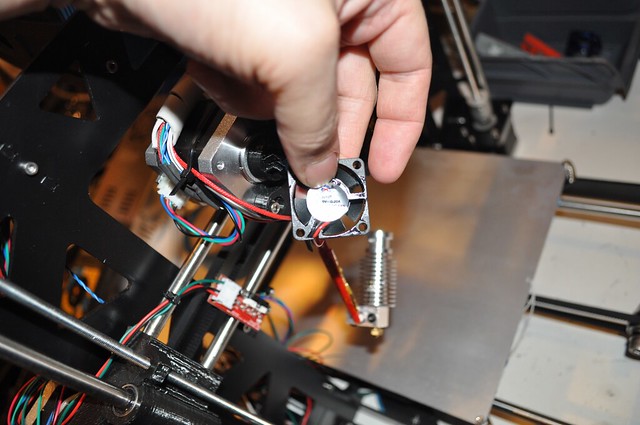
It turns out the fan provided was 5V and the connector supplies 12V. Oops. need to get a new fan, and make sure its 12V !
I Setup Marlin on the arduino. I pulled the latest RC from git and configured everything (LCD, endstops, heat etc). I've put my current config on my github https://github.com/paulhurleyuk/Marlin.
I Setup Pronterface and Slic3r (and Skeinforge if I want to try that) and connected succesfully. Again, my Slic3r profile is on hithub here https://github.com/paulhurleyuk/Slic3r. Homed all the axis and heated things up, all working apart from the fan.
Page 1 of 12